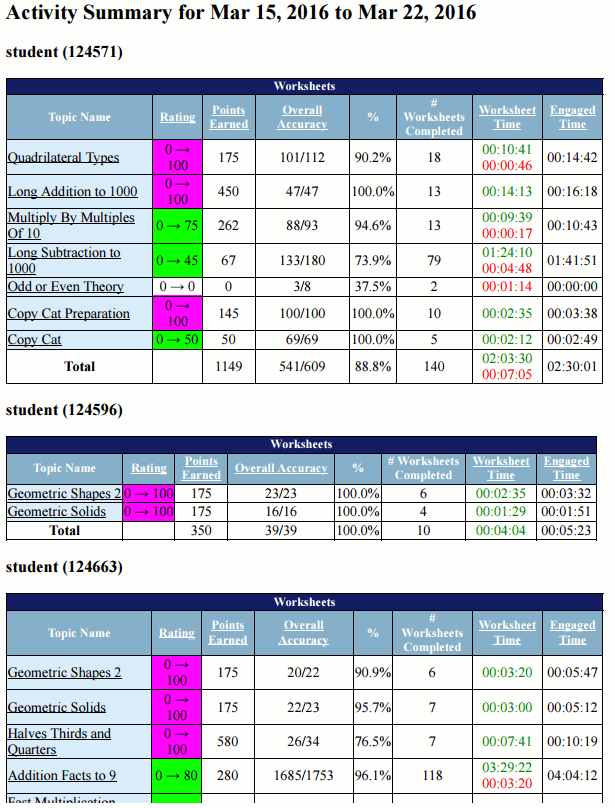
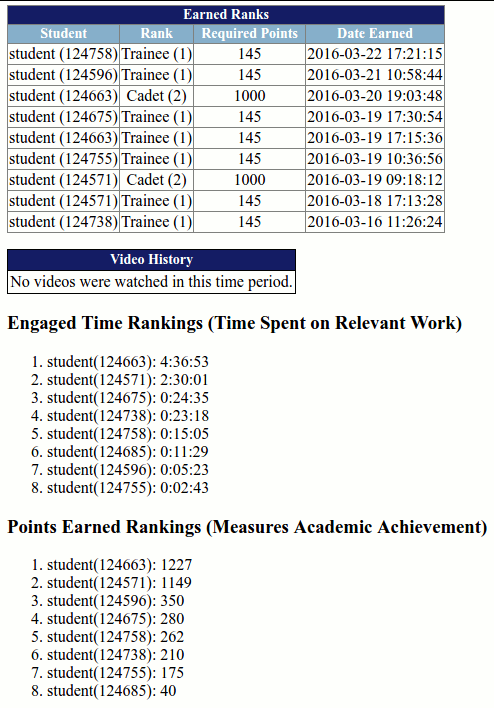
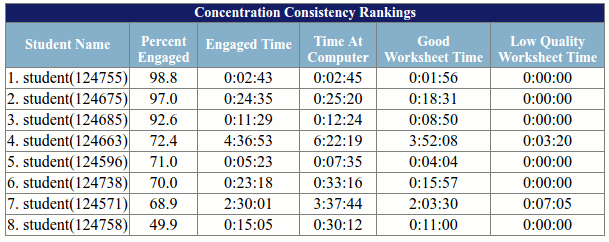
Here is an example of an activity summary. Please take a look at the report first, then read about the benefits below the report.

What to do with this data
As you can see here, activity summaries show very precise data regarding student progress. The purple color indicates new mastery of a topic (rating rose from below 100 to at least 100) within the timeframe. Green color shows improvement. In a more rare circumstance, red would indicate a decrease in rating for a topic.Worksheet time describes the amount of time that actually counted down on the clock when doing worksheets. Green worksheet time is considered productive effort and red worksheet time is considered wasted effort. To prevent reverse engineering of the wasted time detection algorithm, we do not explain this in detail except to say that we try our best to differentiate between actual work and playing around. Our engaged time analysis is mostly based on good worksheet time, and takes into account some of the time spent between worksheets, such as when you might be reading solution explanations.
Ordinarily, you should run activity summaries for a single day or for a week. For longer timeframes, the student highlights report generally makes more sense.

At the bottom of an activity summary, students are ranked by various metrics. If you want to motivate your students, the best possible thing you can do at the end of a MathScore usage period is to name the top student students that worked the hardest, based on engaged time rankings.

The very last item in an activity summary is the concentration consistency rankings. Generally speaking, 70% engaged time is the cutoff for guessing if students are using MathScore seriously. Anybody achieving less than 70% engaged time should be carefully watched the next time they use MathScore. Such students are likely talking too much and playing with their neighbors. They might also be working on topics that are too easy for them. We take engaged time very seriously. In general, students that use a computer always appear to be engaged, but the truth is, some students (roughly 20%) like to waste time. By paying attention to the activity summaries, you can clamp down on these students.
Activity Summaries Work in Real-time
If you want to be a top tier MathScore teacher, you should run activity summaries while the students are using MathScore. By watching student progress as it unfolds, you can quickly adapt to poor user engagement issues quickly so that students do not waste too much time. Watching your computer screen with real-time activity summaries is frankly much more effective than walking around the computer lab, glancing at only a few students's screens at a time.How to Access this Report
As a teacher, click on Track Progress, and if prompted, select a class. In the sidebar area, find the area called View Progress, select the Activity Summary radio button, pick your dates, and click on Get Progress.As the admin, click on Students, then View Progress. Select a class or grade level. In the sidebar area, find the area called View Progress, select the Activity Summary radio button, pick your dates, and click on Get Progress.
By the Way
Ordinarily, the student names would be intuitive, but they were renamed to protect the privacy of the customer.Next: High Level Reports →
